top of page

Proposal Report
Below is the Proposal Report for our Senior Design project.
Design Report
Below is the Design Report for our Senior Design project.
Design Report
Below is the Design Report for our Senior Design project.
Progress Log
Below is the Progress Log for our Senior Design project.
Week 28 (11/14 - 11/20)
The team is working on updating the website.
Jen: Worked on updating the website and the design report.
Lexi:
Worked on compiling video and the design report.
Week 27 (11/7 - 11/13)
The team is working on updating the website, DES and DER, and report.
Jen: Worked on updating the website and the design report.
Lexi:
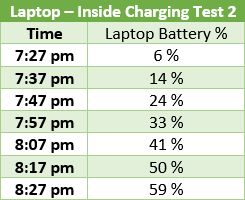
Conducted a test to observe how fast the laptop would charge using an at-home outlet. The point is to compare the data to the charging station system. Also worked on design report and process data.


Week 26 (10/31 - 11/6)
November 1, 2021
Conduct a test on the battery's charge and discharge. Setting up, start by plugging a fan into the inverter. The battery is measured using the solar charge controller, and the experiment began at 11:30 pm. The majority of the day was cloudy.
The lowest temperature of the system began early in the morning at 71.6 degrees Fahrenheit. The highest temperature reached was 80.6 degrees Fahrenheit.


Data for this testing is collected every 10 minutes for 1 hour and 10 minutes. The battery's voltage level remains the same when the charge and discharge are the same. Based on the data collected, the battery remains the same.
Jen: Worked on taking measurements of the system for 3.5 hours using the solar charger controller to read the battery's voltage.

The fan is constantly pulling power from the inverter that is attached to the battery. Data for this testing is collected every 10 minutes for 2 hours. The battery's voltage level remains the same when the charge and discharge are the same. The battery is also providing the microcontroller and the power of the motor. Based on the data collected, when the system is running, and the fan is connected, the battery remains the same.


Week 25 (10/24 - 10/30)
October 29, 2021
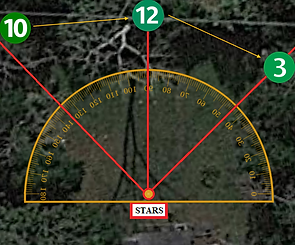
Based on the environment, the solar tracking system is restricted. The motors can rotate 270 degrees, but since there are large trees from each side of the system, the guiding system will only allow the system to move between 45 degrees and 135 degrees.

Looking at the data, the system's solar panels start to receive an adequate amount of sunlight between 11 am to 3 pm. The reason behind this is that the testing environment many tall trees that would block the sun from casting their light rays onto the light panels.
October 28, 2021
Troubleshooting the tracking system was conducted on this date.
Jen: Worked on testing the solar tracking system. The program will move the panels to face east. Retesting the components to make sure they are still functioning. Editing the video, and an issue came up. After assembling the video, the video would not open.

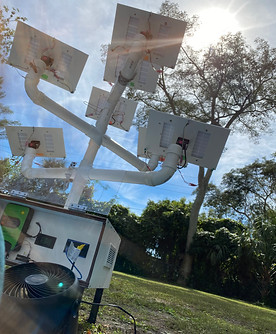
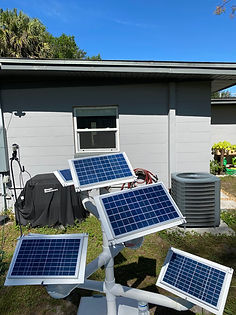
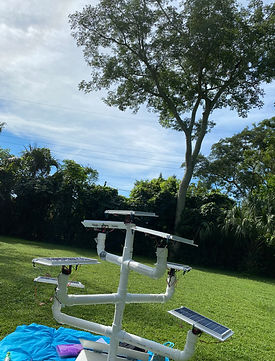
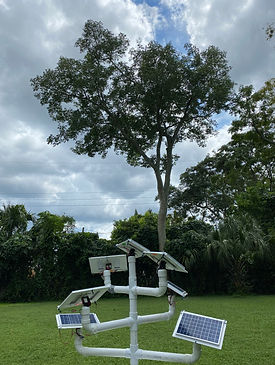
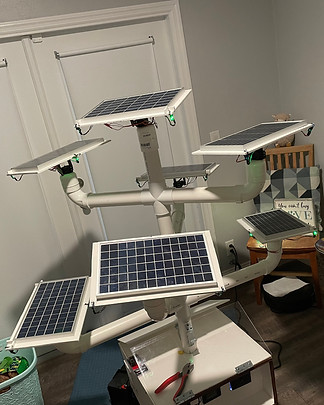
Test each solar tracker system. The image to the left shows the testing of 4 solar tracking systems and later increased to 7. The system is programmed to set the starting point at 45 degrees for the lower motor. The team realized later that it would direct the solar panels to the west instead of the east. Causes the system to be confused because the light sensor will only move if there is a difference between the three light sensors.

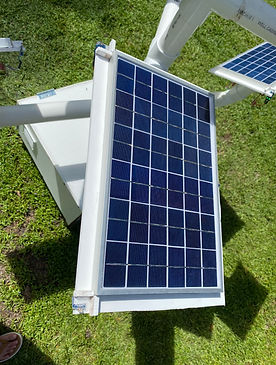
The image on the left is a picture angle of the solar panel on system 1a. System 1a is the second level from the top.
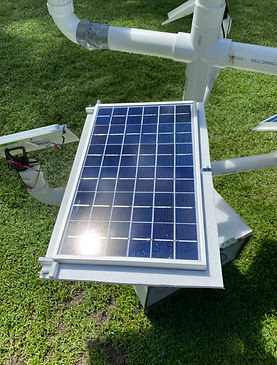
The image on the left is a picture angle of the solar panel on system 3b. System 2b is the third level from the top.
A camera is placed on top of the panel to compare with the other level. Comparing these two photos, the higher the solar panel, the fewer objects that would block the panels from receiving sunlight.
October 27, 2021
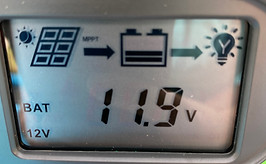
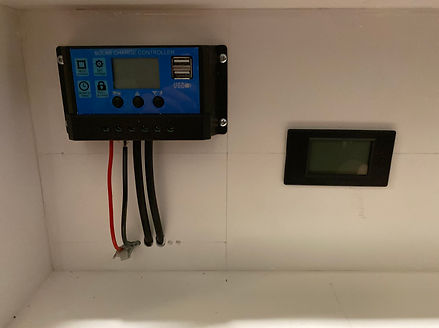
Troubleshooting the tracking system was conducted as well as a power unit check-up. The new solar charger controller can measure the voltage and current of the solar panels and the battery. The solar panels were also clean since there was a lot of dirt that accumulated over time.
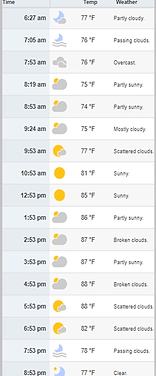
Lexi: Collected the data on the datalogger and created a graph of the system. Also compared the data to the weather to observe the result of the reasonings for the dip. As a team, we observed and agreed on the results. Worked on troubleshooting the project program.
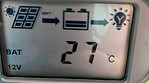
Jen: Worked on troubleshooting the system and cleaning the panels. From 11 am to 3 pm, conducted a check-up on the power unit. Check on wiring, any moisture, and temperature. Some wires came loose from the Arduino, and the temperature was around 27 degrees celsius. Also compared the data to the weather to observe the result of the reasonings for the dip.
As a team, we observed and agreed on the results.

Comparing the specifications on the solar panels and data that was measured, the voltage max should be 18V when solar panels are wired in parallel.

Comparing the specifications on the solar panels and data that was measured, the current max is 0.56A, but since there are seven solar panels and it's wired in parallel, the max current should be 3.92A
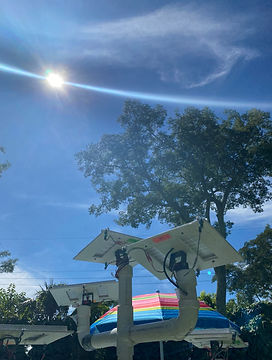
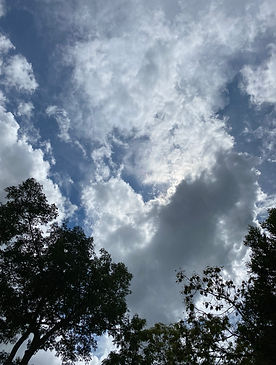
Solar Tracking panels at 1 pm:
Around 1 pm, the sun is behind a large tree, but the system is still getting some sunlight. There were issues but later solved after some programming. The threshold needed to be adjusted.
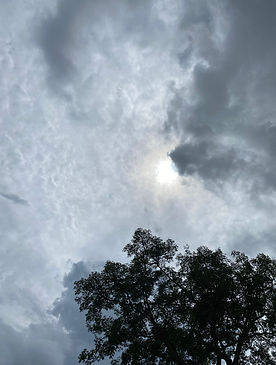
Solar Tracking panels at 3:12 pm:
Around 3 pm, the sun moves to the west, and the tracking system angle the panels more towards the west. There were also trees blocking the sunlight from casting onto the solar panels.


Troubleshooting Day:
The program needs to be adjusted even more. Based on data obtained on October 26, 2021, the solar panels were getting anywhere close to 3A, but with some adjustment, it was able to get to 2.9 and higher.
October 25, 2021
Based on the data collected, the system is collecting more towards the end. The system did not generate as much power as our team wanted. The team discussed able troubleshooting the system the next day.
Lexi: Collected the data on the datalogger and created a graph of the system. Also compared the data to the weather to observe the result of the reasonings for the dip.
Jen: Also compared the data to the weather to observe the result of the reasonings for the dip.
As a team, we observed and agreed on the results.

Week 24 (10/17 - 10/23)
The team did more research to find the reasoning behind the loss of power. Based on the graph generated for the previous data collection, the solar panels could, at most, generate 40-45 Watts. The seven solar panels should be generating close to 70W in total.
After some research, the team believes that the solar panels are not generating closed to 70W is that the solar charger controller is regulating the voltage. There are two types of solar charger controllers:
Pulse Width Modulation and Maximum Power Point Trackers
For our project, we selected a Pulse Width Modulation Solar Charger.
With a pulse width modulation (PWM), it pulses power into the battery. When connecting a solar panel and the battery to the PWM, the battery would pull the solar panel voltage down close to the battery voltage. Ipm current should be around 3.92A, as the specification of our solar panel shows that one panel should generate an Ipm of 0.56A (0.56 * 7 = 3.92). Based on our current data, our current has been hitting around that mark with good weather and when sunlight hits all panels.
Here is a link that helped us come to this conclusion: Clean Energy Reviews
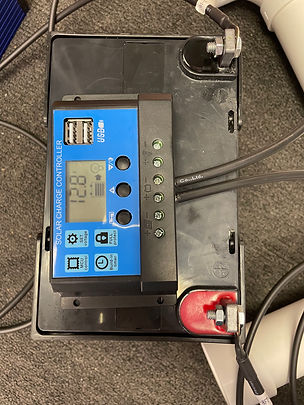
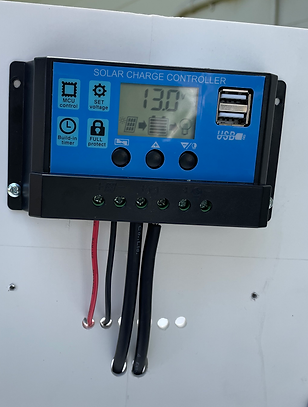
Based on feedback and the data collected selected solar charge controller was not efficient and did not retain maximizing power for the system. For the system to retain and maximize power, the PWM solar charge controller was switched with an MPPT solar charge controller.
A maximum power point tracker is used to optimize the voltage of the solar panel for maximum power output. Based on the website, MPPT is 30 percent more effective compared to a pulse width modulation (PWM) solar charge controller. As mentioned before, the current solar charger for our system cannot generate the max voltage output. It is producing 35.7% less than the expected value. With an MPPT, it will convert the output power of the solar panel instead of lowering the voltage. An MPPT solar controller is similar to a DC to DC converter.

Here is a link that helped us come to this conclusion: Clean Energy Reviews
After obtaining the MPPT solar charger controller, it soon replaced the PWM solar charger controller.
Lexi: Worked on replacing the solar charger controller and followed the manual to install the new solar charger into the system.


The new solar charger requires new holes to mount the system. This new device includes a temperature reader, which we used to measure the temperature in the power unit. The solar charger is also connected to the data logger to measure the voltage and current of the solar panels.
After the feedback received on the current recording setup, the go pro with be moved closer to the system.
Jen: Worked on drilling a hole so that the go pro could be charged while filming.
Lexi: Worked on setting up that camera to film the system.

This week our team worked on the data logger testing, measuring the panels, and calibrating the solar tracking system. The program of this system has been altered where the threshold has decreased from 5 to 4.
The solar tracker movement is immediate. When there is a cast of shadows, the system will move the panels.
October 20, 2021
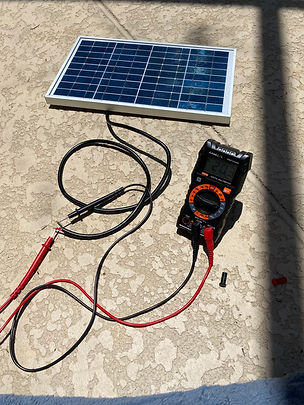
Jen: Worked on calibrating the solar tracker by taking data and adjusting the system in the program. Took measurements of the solar panel output by multimeter. Updating the website and work on the weekly presentation. Updating progress log weeks 24.
October 18 , 2021 -
Based on the feedback from our weekly meeting, the solar panel's specifications are not the same as what the website has given. On the website, the panels were to have a Voc of 20V, but the Voc of the solar panel received were 22V. All solar panels had a Voc of 22V and Isc of 0.61A.
Jen and Lexi:
Worked on gathering the specification of each solar panel.


Jen:
Worked on calibrating the solar tracker by reading the reading of each light module. Used the program to read the light module and adjust the difference as well as decrease the threshold. The system seems to follow the sun more accurately, but more testing needs to be done.
October 17 - 19, 2021 -
The data logger is being tested using the system. Instead of building a circuit and seeing if it would take the reading, it is tested with the system. Before, the data logger would read the load voltage and the current passing through the sensor.
Jen:
Worked on data logger and tested the voltage and the current using a multimeter to measure the end of the solar panel. Compared the data to the data logger and see how accurate the data logger was.
Week 23 (10/10 - 10/16)
October 10 - 16 , 2021
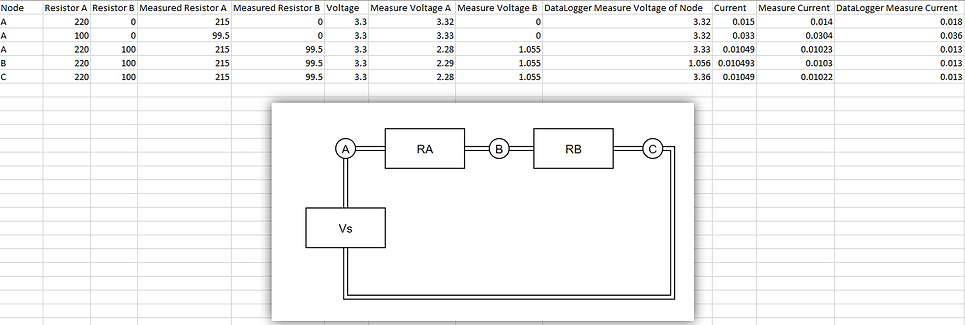
Since there was no problem with the solar panels and the team has addressed the solar tracker light module that needed to be replaced has been replaced. Jen worked on the data logger. In the previous weeks, the data logger went through some testing for accuracy. A simple circuit was used to test the data logger. It can measure the voltage and current of a simple circuit.m that had a voltage source of 3.3V and was in series with a 1K ohm resistor.
Retesting the data-logger once again, it then again shows the same results. Since the results are the same, Jen went and did more research on the power sensor.
The next day, Jen built another circuit to test the data logger.


Testing the data logger and observing what the data logger is reading.
Jen: Working on the data logger and observe that the data logger is measuring the voltage load and not reading the voltage input. Additional testing on the data logger was needed. Another circuit using a 220-ohm resistor and a 100-ohm resistor was used for the testing.
After testing them separately, they were combined as one circuit. The circuit flow was like a voltage source, power sensor, and then the two resistors. The readings closely match the expected measurements. The power sensor was then connected between the two resistors. The power sensor would measure the voltage of the one resistor that the current is flowing in.
Here is all the data that was recorded for this testing. The data logger seems to measure the current as of the same and the voltage load. So based on this data, the data-logger could be just measuring the solar charge controller and now the solar panel’s output.
Week 22 (10/3 - 10/9)
Saturday, October 9, 2021 -
From our feedback, there are either issues with the data logger or the system. Based on the testing, the issue is with the data logger's voltage reading.
Test Conducted:
-
Measure Solar Panels
-
Testing Light Sensors


Voltage of the System at 1
Current of the System at 1
Testing solar panels: There were issues with the reading. The data measured by the data logger shows the system is producing a max of 40 - 45 W. System should be generating 70W, and since it is not, this arises an issue.
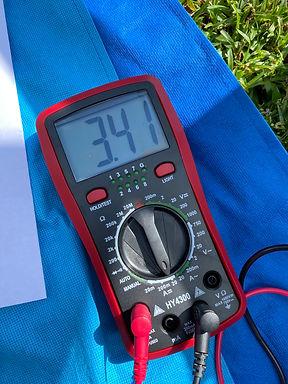
Working on measuring panels by disconnecting the panels from the system. A multimeter was needed to measure the Voc and Isc. Based on the measurements, this system is able to generate the 70W.
System is generating: 20.7 * 3.41 = 70.587W @ 1 pm
Working on the solar tracking system:
Jen: Worked on light module testing by creating a program that prints the measurements. Help with angling the panels toward the sun and see if there are any outliers. Able to locate which sensor was damaged.
Lexi: Working on angling the panels toward the sun and adjusted any light modules that were giving issues. Three light modules were giving a bad reading.

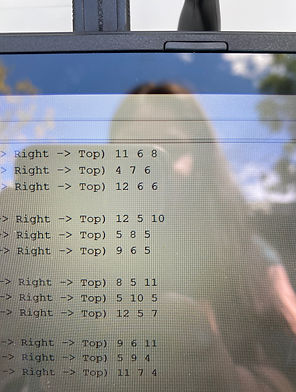
Bad reading on Top Panel - Left Light Module
Light modules were replaced
October 3 - 8, 2021
Issues have occurred, and as a result, the group focused on working on the report and updating the website. The group has submitted chapter 1 to the writing center to be proofread.
Jen: This week worked on the report, mainly on Chapter 3, and updated the website progress log. While writing the report, she was thinking about ways to resolve the solar tracking system. Trying to understand why the values of the light sensor constantly vary.
Lexi: This week worked on editing the report to ensure the correct format and updating tables, like the engineering requirements.
Week 21 (9/26 - 10/2)
Issues are still occurring and based on the feedback with our advisor, four of the solar tracking panels will need to be addressed. The movements are still not ideal for the tracking system. There might be an issue with the light modules readings that would cause the solar tracker to move in a different direction. The remaining of the system seem like they are functioning.
Wednesday, September 29, 2021
Jen: Worked on the solar tracker that was giving some issues. 2a still has wires issues, 3a solar tracking system is still flipping in the opposite direction. Solar tracking has yet to be solved due to the weather. Tested the connection using a multimeter. The multimeter has a continuity test function that will signal if there is a connection. After addressing the issue with these panels, it was time to observe if that individual will function as intended.
September 26, 2021 - September 28, 2021
The team is working on updating the website and report for the upcoming weekly meeting.
Jen: Working on updating the website and the design report. Also, work on the weekly presentation. Updating progress log weeks 20. Looked into the weather to compare data received from the data logger.
Lexi: Working on the design report. Also, work on the weekly presentation. Processing data and working on video editing.
Week 20 (9/19 - 9/25)
Data collecting:
Lexi: Takes the Data from the data logger. Compares the data to the weather forecast.
Jen: Observes the data and confirm if it's reliable. She also updates the progress log.


Wednesday, September 22, 2021
Based on the testing on Tuesday, September 21, 2021, a few solar trackers are undergoing troubleshooting. Yesterday, there were issues with 3 of the solar trackers. The wires seem to be too short, and when the system is in motion, the wire would disconnect.
Work for this day:
Jen: Worked on a few of the solar trackers. Based on observation, some of the wires were coming undone when the system is in motion. Issues were still in the wiring of the project. It is hard to tell if there are any other issues.

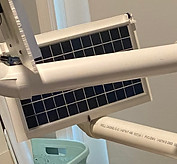
Testing the one panel. The panel in the image did adjust to the sun, as you can see in the reflection. The top solar panel above blocked the solar panel underneath, and as a result, it did move.
Based on all the testing, the system should function as intended. As long as the wires are connected, the panels should be pointing at the sun.
In the image to the right is a picture of the system underneath the sun. One panel is tilted at 90 degrees because the panel above was blocking the sensor. If any issues occur, we should test the solar panel. If it moves left, right, up, and down, we can conclude that the servo motors are working. By blocking the light modules, it should cause the servo motors to adjust.

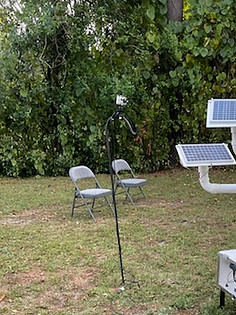
This is the process that was taken, in the video, of testing the solar tracking system. Jen tested the solar tracking system by fiddling with the light sensor and motors. If the solar panel moves left, right, up, and down, we can conclude that the servo motors are working. By blocking the light modules, it should cause the servo motors to adjust. Our team needed to work on each solar tracker so that it would follow the sun.
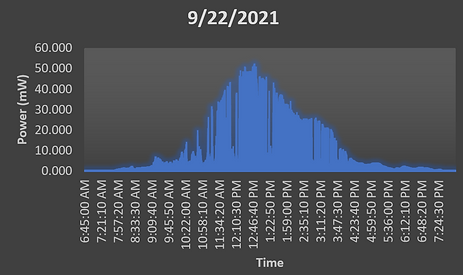
The data on this day will be inaccurate due to testing. We were able to generate power during the process. Jen was troubleshooting and testing the program.
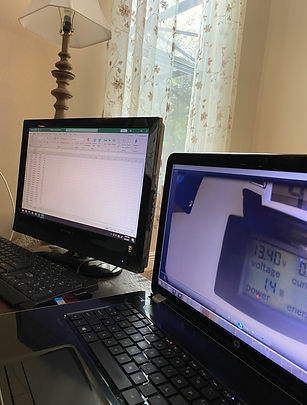
Lexi: Works on connecting data. Takes the SD Card out of the slot of the data logger. Connect the SD card to the laptop. Lexi then works on building the graph. In the Excel file, the current, voltage, and power are saved in each column. So she takes the data and creates a graph. Compares the data to the weather forecast.
Tuesday, September 21, 2021
Based on the testing on Monday, September 20, 2021, the solar trackers need to be adjusted to follow the sun.
Work for this day:
Jen: Worked on each solar tracker by disconnecting them and testing them one at a time. Issues with the wires had occurred where the connections would come unattached. This issue may be caused by too much heat that was applied when using the heat gun. We had to tests the connection using a multimeter. Clamp the wire connector so the wires won't get undone. But sometimes when the whole system is running, it would come up done.


Jen started to work on each solar tracker. Starting with the top panel and set the other six panels to 90 degrees. She starts by disconnecting all the solar panels and only connecting the top panel. Then connected the program and lower the threshold from 5. It had a higher threshold so that the solar tracker would not constantly moving back and forward often. The picture on the left is the top solar panel position.
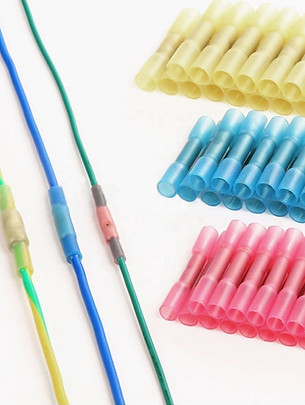
There were issues with the wire connectors. The wire connector needed to be heated with a heat gun for the tube to shrink. That will hold the wires in the connector tubes in place. A few of the wire connectors were not clamped down so that the wires inside may not have a connect connection.
The picture on the right shows what the wire connectors would look like when they are clamped down.


After clamping down panel top, 1a, and 1b, Jen then connected the system to the Arduino. The top 3 panels seem to adjust themselves, and it looks like none of the panels are blocking each other so far.
The picture on the left shows how the wires are connected and the three panels from the bottom view.
This is the process that was taken, in the video, of testing the solar tracking system. Jen tested the solar tracking system by fiddling with the light sensor and motors. If the solar panel moves left, right, up, and down, we can conclude that the servo motors are working. By blocking the light modules, it should cause the servo motors to adjust. Our team needed to work on each solar tracker so that it would follow the sun.

The data on this day will be inaccurate due to testing. We were able to generate power during the process. Jen was troubleshooting and testing the program.
Lexi: Takes the Data from the data logger. Compares the data to the weather forecast.
Monday, September 20, 2021
Starting this week, our team focused on troubleshooting the solar tracking system outside. Seeing what's functioning and what's need to recalibrate. There are some issues with the wiring that may cause issues to the response of the system.
At the beginning of this week:
Jen: Worked on the Design Report. Data logging in Chapter 2, and more on the construction phase in Chapter 3. This week, she collected data on the Solar tracking system by fiddling with the light sensor and motors. If the solar panel moves left, right, up, and down, we can conclude that the servo motors are working. By blocking the light modules, it should cause the servo motors to adjust.
Lexi: Worked on obtaining data from the data logger and edit the videos. She takes the SD Card out of the slot of the data logger. Connect the SD card to the laptop. Drag the Excel file so that it would save onto her laptop. Delete the save file on SD Card and return the SD Card to the data logger. Lexi then works on building the graph.


The Bayite multimeter was disconnected caused when we moved the battery to the other side of the base, and the wire snapped off. The Bayite multimeter is used to monitor and display the performance of solar power production.
Jen reconnects the Bayite multimeter and replaced the short wire with a long wire.
We are starting to test the tracking system, and we are slowly trying to adjust it to read sunlight and not a flashlight. Based on the data gather, we much have to adjust the threshold of the light modules. Some troubleshooting is necessary based on the information we obtain from the testing.
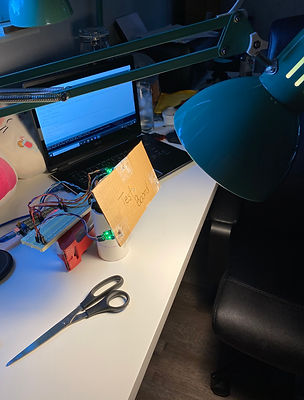
On Monday, September 20, 2021, our team focused on testing the Solar Tracking for 2 hours and stationary for the remaining of the day. The reason behind this is because for the last few days. We are not able to obtain enough sunlight to charge the battery.


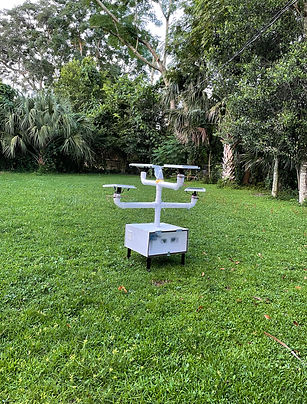
The system was set to stationary for the beginning of the day. Jen went out to check the system at 10:30 am. Looking at the weather, she noted that it was cloudy at that time. Checking the base of the system, and there seem to be no heat issues.
The system remained in the stationary position and then set to track at noon. Jen proceeds to take note of the system. Looking at the weather, she noted that it was cloudy some light at that time. The sun is hiding behind the cloud. Checking the base of the system, and there seem to be no heat issues. Looking over the solar panels, all of the solar panels seem to have light coming in contact. The solar charge control battery icon is blinking, showing the battery is being charged.


.jpg)
At 12:30, the solar tree's system was set up to tracking the sun. After starting the system up, the motorized solar panels adjusted to their spots. Looking at each solar panel, it seems there was no cast of shadow. At the time, it was very cloudy, and it appears not much sunlight was out. There are issues, but the focus was to observe them before trying to fix them.
At 1:30 pm, looking at each solar panel, it seems there was no cast of shadows. At the time, it was very cloudy, and it appears not much sunlight was out. There are issues, but the focus was to observe them before trying to fix them. Jen tested the light modules of each solar tracker and tested the motors. If the solar panel moves left, right, up, and down, we can conclude that the servo motors are working. By blocking the light modules, it should cause the servo motors to adjust.

At 2:30 pm, looking at each solar panel, it seems there was no cast of shadows. At the time, it was very cloudy, and it appears not much sunlight was out. There are issues, but the focus was to observe them before trying to fix them. Jen tested the light modules of each solar tracker and tested the motors. If the solar panel moves left, right, up, and down, we can conclude that the servo motors are working. It seems like the same result as 1:30 pm.
At 2:30, the tracking system was turned off and set to stationary. This is so that the team could save battery. For the past couple of days, the system was struggling to obtain power to power the system.
Closes to 4 pm, the sun is hidden behind trees which supposes our data collected for stationary.

This is the process that was taken, in the video, of testing the solar tracking system. Jen tested the solar tracking system by fiddling with the light sensor and motors. If the solar panel moves left, right, up, and down, we can conclude that the servo motors are working. By blocking the light modules, it should cause the servo motors to adjust. Based on the data gather, our team needs to adjust the system to read sunlight and adjust the threshold in the program.
Week 19 (9/12 - 9/18)
The team is working on updating the website and report for the upcoming weekly meeting.
Beginning of this week:
Jen: Working on updating the website and the design report. Also, work on the weekly presentation. Updating progress log weeks 18 and 19. Looked into the weather to compare data received from the data logger.
Lexi: Working on motor testing and the design report. Also, work on the weekly presentation. Processing data and working on video editing.
Week 18 (9/5 - 9/11)
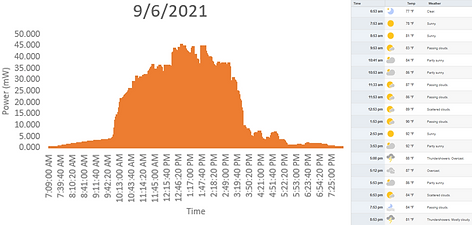
This week, as a group, our team focus on recalibrating the solar tracker on September 6, 2021. We wanted to avoid a rainy day, and that day was our opportunity. We took the chance to reorganized the wires and installed the fan. Light modules were connected to the correct solar tracker and recalibrated.
During the recalibration stage:
Jen: Worked on wiring all the solar trackers to the Arduino. It is important to wire all the trackers correctly so that the Arduino can correspond each light module to the correct motors. Jen also organized the wires, along with ensuring they are connected. Jen assisted in helping rearrange the battery placement. (Focus on disconnecting the battery from the solar charger). Jen also worked on light calibration by using the laptop to read the light measurements. The Arduino had to be connected to the Arduino in order to obtain measurements. Jen also fixed the program for the solar tracker when needed. Jen also worked on installing the fan by connecting to the wires to the fan.
Lexi: Worked on making sure that the light modules are connected. Lexi assisted in helping with the management of the wires and work on relocating the battery closer to the fan. Lexi also worked on light calibration and taking measurements. Lexi also worked on installing the fan by connecting to the wires to the solar charge controller.
We were encountering issues with the connectivity where the light sensor was not fully connected. As a group, we used a wire crimper tool to clamp on the wire connectors.
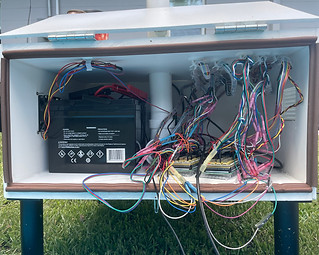
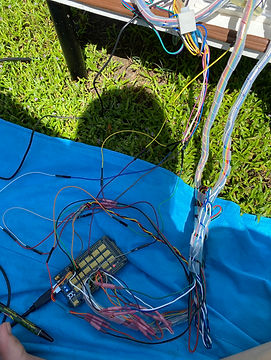
Here is the image of Jen and Lexi working on the power unit system of system. Lexi moves the battery was to the left, close to the fans. Jen connects the battery to the solar charge controller.
Jen wired the solar trackers to the Arduino. The wires are attached to the ceiling of the system. Each solar tracker can be taken accounted for, and this allows less confusion.
Lexi assisted in the arrangement and passing the wire management clips.


In this image, Jen is taking data of the light modules and writing the data. Some calculations were needed, and a calculator was needed in hand. Laptop was needed to read the numbers. Paper was used to drop down notes.
Our team proceeded to take stationary data for the remainder of this week. Lexi worked on creating graphs with the data collected from the data logger.
The process of taking data:
Lexi is using the data logger that Jen made that can save up to 32 GB of data. She takes the SD card every 2 or 3 days out of the data logger.
Lexi: Takes the SD Card out of the slot of the data logger. Connect the SD card to the laptop. Drag the Excel file so that it would save onto her laptop. Delete the save file on SD Card and return the SD Card to the data logger. Lexi then works on building the graph. In the Excel file, the current, voltage, and power is saved in each column. So she takes the data and creates a graph. Compares the data the weather forcast.

Here are all the data saved and created into a graph. Lexi made the graph and used Weather underground to compare the data. Jen made the PowerPoint slides and dropped all the information onto the weekly slides.
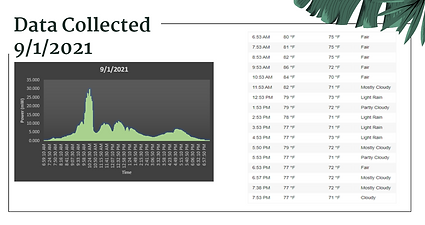
Based on the data, the weather closely resembles the times and dips that occurred in our data.
In our last meeting with our mentor, Professor Notash, he suggested we take some data of the solar panels angled 45 degrees.
Jen:
Worked on creating a program that will set the solar panels to 45 degrees.


Data collecting for this week:
Lexi: Takes the SD Card out of the slot of the data logger. Connect the SD card to the laptop. Drag the Excel file so that it would save onto her laptop. Delete the save file on SD Card and return the SD Card to the data logger. Lexi then works on building the graph. In the Excel file, the current, voltage, and power are saved in each column. So she takes the data and creates a graph. Compares the data to the weather forecast.


Set panels to a 45-degree angle. Issues the placement of the three panels occurred.

3B was off by 45 degrees.

The upper motor had to be adjusted phyiscally.

The issue with motor 1A not functioning.
After loading the program into the Arduino, there were noticeable issues that occurred looking at the system. Two panels seem to be flip upside down. Though it does not impact solar tracking, our team would like to keep it consistent. Our team also noticed that one panel is angle correctly.
Jen: Starts to work on fixing and testing the motors. The two upper panels were upside-down has got resolved just by editing the program and loading it to the Arduino. Jen also tests the solar tracking panel's motors. Just in case there was an issue with the servo motor not be assembled correctly. The servo motors for 3B were flipped and needed to reconnect to the Arduino. 3B upper servo motor needed to be adjusted because it was off by 45 degrees. The upper motor of 1A seems to have issues and went under testing. Jen tested the wire connection and signal connection. The motor issue for the upper servo motor, 1A, was solved at a later date.


1A, the upper servo motor issue, was addressed at a later date. After testing more testing, there were issues with wire connections.
Lexi: Starts to test the upper servo motor of 1A and noticed the wire connection issues. The motor's port was a solder, but there were issues with the solder paste touching. Lexi resolves the issue by resoldering so that the wires aren't soldered together.
Website Update:
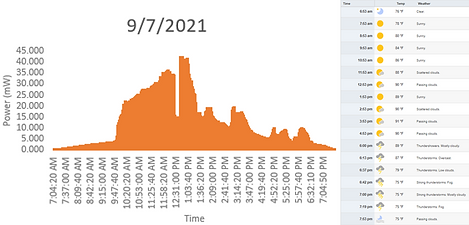
Jen: Worked on updating the progress log, worked on the report, and created the PowerPoint for the 9/7/21 meeting. Before it was brief, she is now going back to update the progress log till week 17 (8/29-9/4).
Week 17 (8/29 - 9/4)
Jen: Since the last meeting, she worked on updating the website and including the data logger in the project. Jen had to go back to the block diagram, flow chart, and engineering requirements and add the information she gathered to build the data logger system. Jen also assisted in creating graphs for the data obtain from the data logger. Lexi emailed the data, and Jen helped create the graphs so that she could add them to the PowerPoint. She also compared the data to the weather forecast.
Lexi: Takes the SD Card out of the slot of the data logger. Connect the SD card to the laptop. Drag the Excel file so that it would save onto her laptop. Delete the save file on SD Card and return the SD Card to the data logger. Lexi then works on building the graph. In the Excel file, the current, voltage, and power are saved in each column. So she takes the data and creates a graph. Compares the data to the weather forecast.
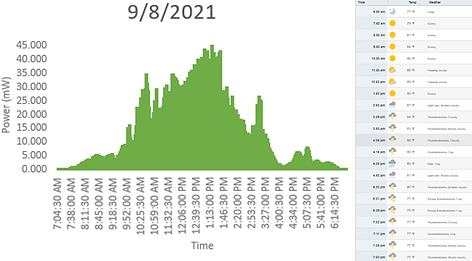
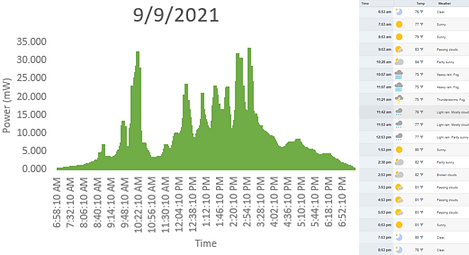
This week our team focused on taking stationary data to test the data logger. After taking data for August 29, 2021, we were able to log the obtain data from 7:45 am to 7:50 pm. The voltage remains around 12V for this solar panel. Lexi worked on collecting data and recording the system. Lexi and Jen worked on creating the diagrams.


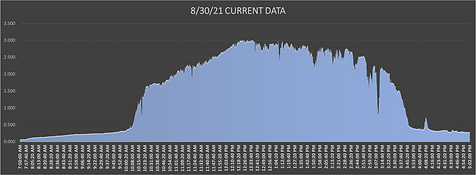
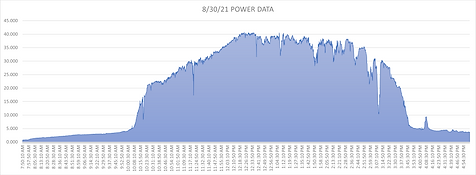
These are the data taken for August 30, 2021. Using the data logger, There is a difference between Sunday and Monday. Comparing Sunday and Monday's data shows that the data logger is working, and the amount of sunlight isn't the same every day. Our team will need to research what is happening on what is happening around 3 pm because there is a continuous dip around that time.
Our team did not know that the datalogger, which Jen built to measure and log data of the solar panel's output, will have to be included in the project block diagram, flowchart, and budget.
Jen: Worked on updating the block diagram, the flow chart, and all the things that need to be adjusted.
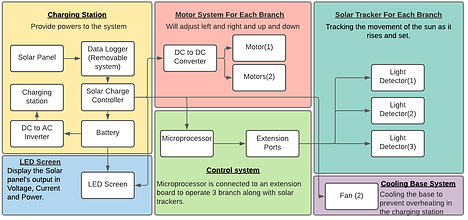
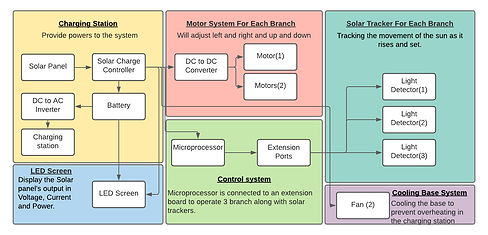
Here are all the updates of the Solar Trees Block diagram and Flowchart. Also, includes the Datalogger block diagram and Flowchart below.
Solar Station Flow Chart

Data Logger Flowchart
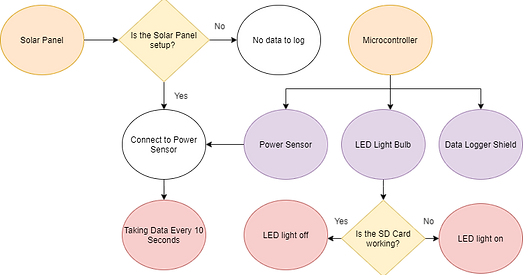
Solar Station Block Diagram
Data Logger Block Diagram
.png)

This week, our team got together to work on the solar tracker. We tested the tracker and ran into a couple of issues. We plan to address the issue at a later date due to rain. We couldn't do much testing. We want to avoid exposing parts to rain which could damage the system because we had to pull the components out to test.

Jen: Worked on wiring all the solar trackers to the Arduino. Jen also worked the solar tracking system by using the laptop to read the light measurements and motors. The laptop had to be connected to the Arduino to obtain measurements. Jen also fixed the program for the solar tracker when needed.
Lexi: Worked on making sure that the light modules are connected. Lexi assisted on light calibration and taking measurements.

Before the rain occurred, we started testing the tracking system, and the system would adjust but did not track as we wanted. Some of the panels did move towards the light, and some move away. We noticed some light sensors were connected to the wrong panels. Before we could fix it, it started to rain.
We took the opportunity to figure out the issue with the data logger. The current was reading negative in the data logger, and this was happening in the testing phase. The team realized that the input of the solar panel to the power sensor was incorrect, and the issue was resolved.
Since Jen built the data logger, the data logger is now taking data of the solar panel's output. Lexi would then take the data, saved it into the SD Card as an excel file, and create a graph.
Observing Data:
Jen: Looked for websites that shows past weather in the last few days. Observe data obtained and compared data from website.
Lexi: Looked for websites that shows pass weather in the last few days. Create charts for the data on excel. Observe data obtained and compared data from website.
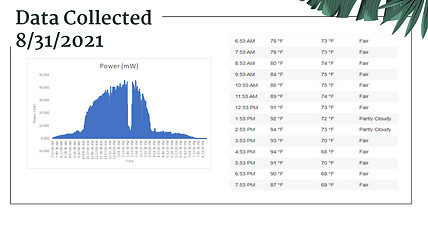
We presented our data on August 31, 2021. Our mentor, Professor Notash, noticed a dip in our graph from our data on August 29, 2021. We had a video recording of that day, and we used the website, Weather Underground, and noticed it was a cloud day at one point throughout the day.
August 29, 2021 Current
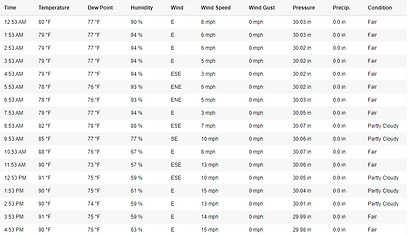
August 29, 2021 Weather Underground
Website update:
Jen: Worked on updating the progress log, adding datalogger to project, and created the PowerPoint for the 8/31/21 and 9/7/21 meeting.
New Semester: New Requirements
Progress Log will now display individual work!
Week 16 (8/22 - 8/28)
This week our group worked on setting up our system so we can start testing the system outside. We worked on updating our website, which is includes fixing our block diagram and our design specification. We also develop a new schedule that will keep us on track with deadlines for this semester.
.png)

The development of our data logger is still in progress. Last week, our team managed to get the power sensor and the data logger shield to work. The next step is to install an LED light that will indicate if their data is logged onto the SD card. The issue from last week was that the data logger wasn't logging onto the SD card. To ensure that we are leaving the system that is logging data and LED was needed.
Data logger
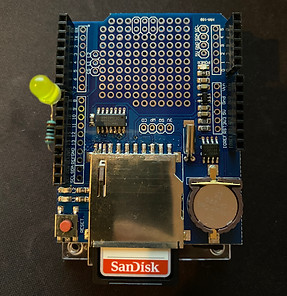
Not taking SD Card
Taking SD Card
This week, our team connected the data logger to the solar station and have it log data for stationary. We manage to fully construct the system and have all the wires relocated to the side motor. The solar tracking system needs more troubleshooting, and we are hoping to resolve that issue next week.


Week 15 (8/15 - 8/21)
This week, the main focus is working on a data logger to gather data. The issue we are encountering is that the solar tree automated recharging station is going to be placed in a yard alone for the majority of the day. In the previous setup, someone had to monitor it and change the SD card every 4 hours. A data logger is needed to record the data.
For the majority of the week, there were issues with having the Arduino not able to read data from the power sensor. It was then resolved days later after some intense trial and error.
Below shows that the Arduino can recognize the power sensor.

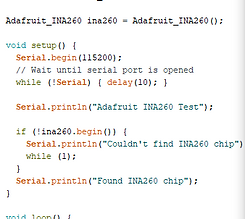
With lots of trials and errors, the data logger seems to work. The data logging system should be able to measure the current and voltage using a power logger that will allow the max current of 15A and bus voltage of 0V to 36V. For testing, it is wired to a led light bulb connected to the resistor.

With this, our team needs to include a real-time program, and it should measure the current, voltage, and power showing at what time. The issues that delay the development of the data logger were that there were issues with the Arduino wasn't able to read the SD card. Just the development took days because issues weren't resolved as quickly.
The group came together to install the motors and refix the light modules. Issues that came across were that the drills and jigsaws were not able to cut through the PVC pipes. Before we discuss with our mentor about the panels dropping down onto the pipe, and so to resolve the issue, we plan to lift the solar tracker.
Week 14 (8/8 - 8/14)
This week our team's focus is to continue to build the solar tree as we originally designed. Keeping the light modules and light modules, we continue testing the motors and the solar tracker as a whole.
The project was split into two parts so that each member could concentrate on developing the solar station system. One member focused on waterproofing, and the other member focused on the solar tracker aspect.


The system was placed outside as a stationary solar station. The only thing not connected was the Arduino. Some component was placed in a bag to ensure they wouldn't get wet in the process.
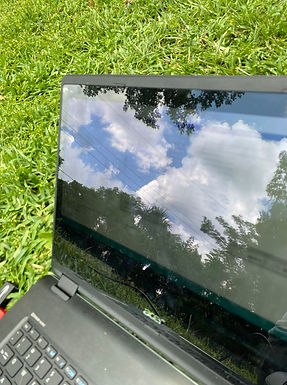
On the first day, the station received some sunlight and endured rain and wind. Around 5 pm, the system has gone under inspection for any leakage. The user viewing area was dry, along with the power system.
The video on the left of this text shows the system powering an amp. Users can connect speakers to our system, which is great for users to use for outside activities.

Our team knows that the Arduino can power a single solar tracking system. The next step is to add another solar tracking. On week 10, our team tested the two solar tracking systems and noticed that the system is not functioning. We proceed by creating a simple program that would only rotate the motors. Since the system continues to crash, we assume that the current was being redirected in the Arduino, causing not enough current to flow into other motors. Our team then tested how much current the Arduino is supplying to the four motors. One VCC pin is connected to all the motors in one node.
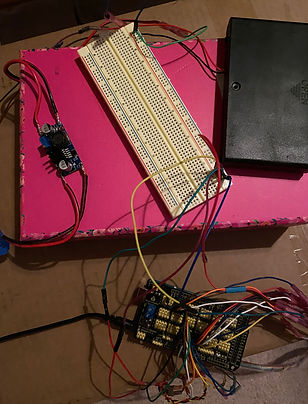
The image on the left shows the circuit created for this testing.
After running the system, using the Arduino as its power source, the video on the left of this text shows the two systems running but soon crash. The solar tracker system would drop, and the Arduino would then flash, signaling the program is restarting.
The video shows a low current is flowing through the motors, and we concluded the solar trackers are not receiving enough current from Arduino. So our best option is to do research and find a way to power the system.
After some research, we believe that the motors had to receive power from a different source. Our team planned to obtain the supply from either the battery or the solar charge controller. We will later decide after further testing the motors. To further test the servo motors, one of our team members had a smaller battery pack that could be used to supply the motor power. The small battery pack has an output of 12V. Since the servo motors needed a voltage of 4.8 to 6.8V DC, we use a DC to DC buck converter that converts the 12V to a suitable voltage.
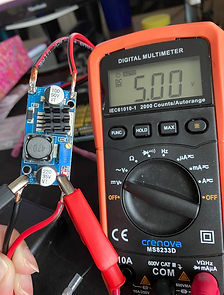
The image on the left is a DC to DC converter. The input source is connected to a battery, while the output is connected to the multimeter. The converter needed to be set in a range of 4.8V to 6.8V. For this test, it was set to 5V.

After setting up the battery and converter, it was connected to the circuit to be tested.
After running the system, using the small battery to supply the power of the servo motor, the are clear improvements to the solar tracking system's movement. The Arduino isn't crashing, and the system seems performer better and longer.
The video to the left is the system running, along with the circuit setup.
This video is showing the other side of the system. There is a visual recording of rotation.

After testing the program and the system, the next step was to record the current of the two solar tracking systems. Comparing the previous test, when the motors are drawing from the Arduino, the servo motors seem to be pulling more current from the DC to DC converter.
Since the servo motor motion test was successful. It's time to proceed to the next step, which is running the two solar tracking systems. Starting by connecting the light modules are to the Arduino and the servo motors to the battery. It was time to run the solar tracking program. Our team was able to achieve enough power to supply two solar tracking systems. The video shows the movement of the solar tracker, but the light modules still need to be recalibrated.
After the success of the two solar trackers, the next step is to add the third solar tracker was to the system. The first video shows the movement of the third solar trackers, but the light modules still need to be recalibrated. The second video shows how much current the motors are drawing from the DC to DC converter.

Week 13 (8/1 - 8/7)
This week was finals week, and some of our team's efforts had to concentrate on exams. We did some modifications to the design and more motors testing. Our team needed to reduce the height of the solar tree, which was over 5'6, and the light modules. If the length of the tree remains, the system remains hard to move. The selected light modules became an issue to our project as they come in contact with the solar tracker's supporting braces. The braces catch the panels from dropping flat onto the PVC pipe. Since we had to test the program often, the solar tracker has to be powered off.
Focusing on the redesign of the tree, our team decided to lessen the levels shorten the tree. In the image below is a new idea for our solar tree shape. (This is not implemented)


With this design, the solar panels will block the panels less. The orange circles in the image are the placement of solar panels. The circle in the figure shows the solar panels will not come in contact as they all rotate.
The selected light modules had to be able to measure light intensity. The light module also came with a potentiometer that would adjust the resistance for the reader. Since the potentiometer on the light modules did not function as intended, there was no point in using this light module instead of photoresistors.
Our team did some testing for the redesign of the solar tracking system. Keeping the three light sensors system, we want to replace light modules with photoresistors. (This is not fully implemented but still undergoing testing)

The image above this text shows a comparison of the previous solar tracking design and the newer solar tracking design lighter design. While testing, if successful, the solar tracker will become thinner than the previous design, and since there is less material, the wind has less area to blow against the panel.
Photoresistors were purchase and used to compare to the light modules. The photoresistor is closer in numbers compared to the light modules. The light module had a lot more outliers that are very noticeable.


Week 12 (7/25 - 7/31)
These weeks our team had other obligations for other classes. Our efforts need to be adjusted slightly towards upcoming exams and presentations to avoid further delays to graduation. More research was towards data logging and, more items required testing the tracking systems.
The Arduino is unable to supply enough power for the solar tracker. We developed a simple program that would run two of the solar trackers at the same time. It was powered but would drop when the solar tracker wanted to hold the panel at a particular angle.
Since we had more time to develop our project, we want to figure out ways to lighten the solar tracker and redirect the motors to a different source.

Week 11 (7/18 - 7/24)
Since we are unable to have our system function, it did put a damper on to morale of the team. This week our team did some research on solar panel data logging. Our team needed to take data while not being around for the majority of the day. Due to work and the cost of traveling to the location, it is important to find a solution to find a more time managing way to collect data.
Solar Power Data Logger:
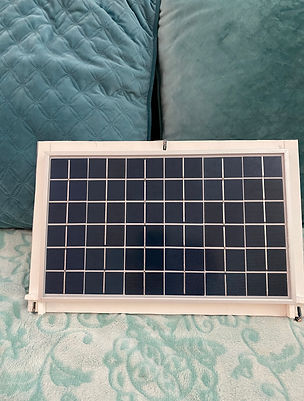
A solar power data logger is used for logging data to measure the solar panel power characteristics. Our system has seven solar panels, and each solar panel is supposed to provide 10W.

Based on research, there are ways to obtain data using a voltage and current sensor. Additional research conducted is on storage data into the arduino.
Our idea is to replace the voltage sensor and the current sensor and purchase one that would do both. The Adafruit 4226 INA260 is said to take a range of 0 to 36V voltage and a max of 15A current.
Week 10 (7/11 - 7/17)
Running across many issues, we had to revaluate our project a bit more. With these issues, our team, unfortunately, had to take some time to redesign the project to ensure safety and functionality of the project. After running 2 of the solar tracking unit, we can across an issue with running more than a single solar tracker. This will heavily delay our time to take data and present it before the deadline.
Since this event, we have had to push back our timeline to fix the project and develop a schedule that will fit into our needs. With our new motors, we had to relocate our wires. The relocation of these wires is so that it won't interfere with the motors moving.
Another issue our team has encounter is the location to take data for the solar station. Our team planned to place the system in an open area backyard but having someone to monitor it became an issue due to life schedule related. One member of the team did obtain some data for a single solar tracker. But since there were a lot of shades cause by natural surroundings, the data taken was not insignificant.


Week 9 (7/4 - 7/11)
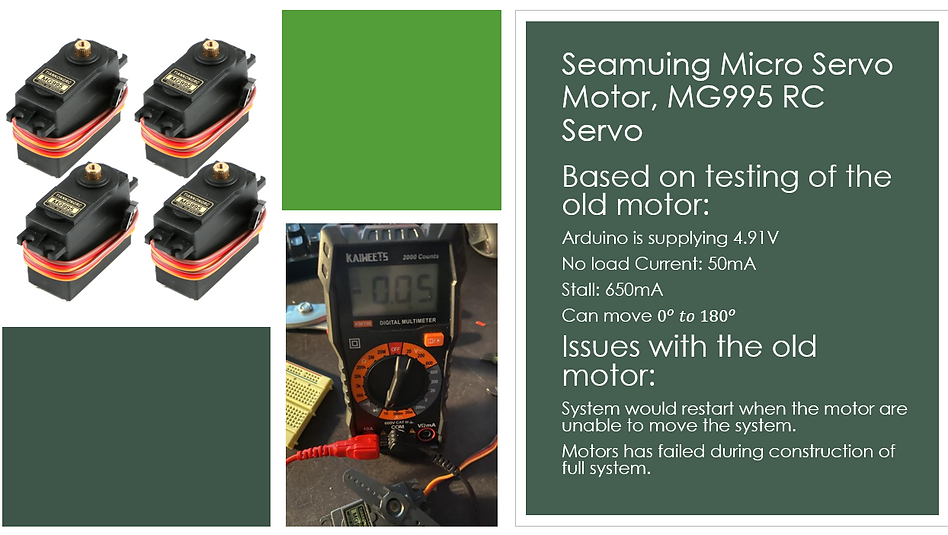
This week, our team did some research on motors to replaced our current servo motors. We obtain approval to purchase new servo motors this week. The new servo motors have more torque and are consider sturdier. Once we received the servo motor, data was gathered on this motor and compare with the old servo motors.
During the time of getting the approval of the new motors, our team had a group meeting with Professor Notash to discuss our progress. We, unfortunately, did not use our time wisely and effectively. A lot of data were missing, and miss opportunities lead to miscalculation. Our team had to recuperate and discuss with Professor Notash about the completion of our project.
After ordering our motors and the discussion about the process of completing our project with Professor Notash, some research was conducted into power logging. If we could find a solution to logging our data, this will help us save a lot of time logging data by hand.
Once we obtain our new motors Saturday night, testing was in progress on these motors, which lead to the comparison between the previous servo motors and new motors.

Once obtaining data of the voltage and current of the motors with no load and with a load, the new servo motors were implementing into one of the solar trackers.
Beginning of the Motor Testing:
Testing of the Lower Motor
Testing of the Upper Motor
Testing of the Upper and Lower Motor
After testing the motors, it was time to implement the program to the solar tracker:
Before:
•Tracks light and delay after 10 or 30 minutes.
•Did not fully take account of Light modules were offsets
After:
•Constantly Tracks the Light.
•System has no delay.
•Considers Light modules offsets.
Once the editing of the program, the program was implemented into the Arduino and the solar tracking testing began. The light modules still needed to be recalibrated.
Using light from Phone while recording.
Using light from another phone.
Week 8 (6/27 - 7/3)
Research was conducted to adding supports to the solar tracker so that the solar panels could rest while the team troubleshoots the system. A design came to mind, and the design is down below.


We also did some programming troubleshooting and testing each solar tracker. Now that we have some braces around the solar tracker, this allows the solar tracker panel to rest on the plates to avoid the tracker falling harshly when we reboot the system.
After continuously testing the motors, an unfortunate situation occurred. The team had to troubleshoot the system due to the servo motors and light module's unresponsiveness. Our team tested the Arduino to see if the Arduino was damage. It was able to supply 4.89V per VCC pin. The test of current was necessary to see if the motor were responsing.


Our team is also working on the report and editing the program to run 1 solar tracker at a time. We also did some research and communicate with Professor Notash to address our issues.
Week 7 (6/20 - 6/26)
June 23, 2021, was the hard deadline to have the whole system assembled. In previous weeks, up to the hard deadline, our team worked together to put the pieces of the solar tree. Our team also continued in testing the single solar tracker, hoping that once we assemble all seven solar trackers, they could track the sun.

After running the system, an issue occurs in the system where the soldering of the wires came undone. Soldering the joints became an issue because the solar trackers are not receiving any signal that causes the system to fail. Once we noticed the problem, the soldering joints were removed and replace with wire connectors. Replacing the solder joint leads to dissembling parts of the system.

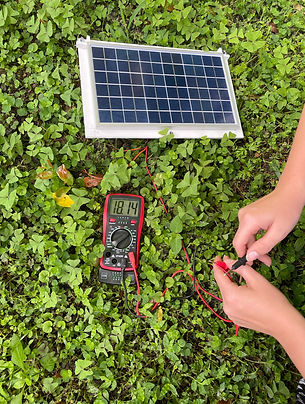
In data collecting, in the graph shown in week 5, there was voltage displayed in the Bayite meter but no current. Since we had to disassemble the system by removing the soldering from the wires and replaced them with connector joints, we wanted to have a picture documenting that the panels were generating current where the Bayite meter fail to read from the 3rd decimal place. Our team took measurements of the solar panel was able to get a reading when the solar panels were in the sun and block by objects.
In the Sun:

Voltage

Current
Shadow casting over:
Voltage

Current
After the reading and the reconstruction of the system by replacing the soldering joints with the wire connectors, we constructed the system and started the program. We notice one light module was unable to connect to the system which we had to replace it for the single solar tracker to work.
There was an issue with the system when the tracking restarts from the system. The solar tracker's panel would fall flat onto the pipes. Like on the image below. When we have to run some troubleshooting on the tracking system, we cannot just disconnect all the panels as now we are looking for ways to allow the solar panels to rest before turning the system on and off.


All panels would drop when disconnected and this is not ideal for our system.
After testing the solar panels tracking system, we notice that some of the solar trackers were not following the light. So we will have to go and obtain information on that individual solar tracker. From previous experience, we assume that the resistance of the light modules is not close to the same resistance and will have to adjust the potentiometer.
Our team is also working on the reporting of the design of the system this week.
Week 6 (6/13 - 6/19)
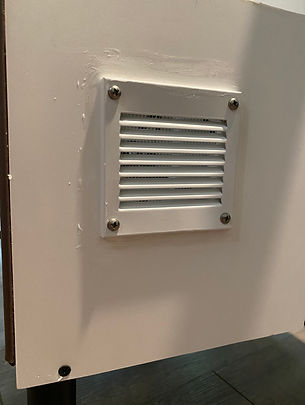
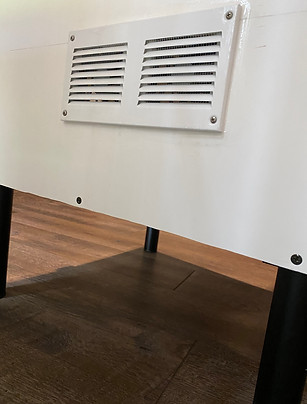
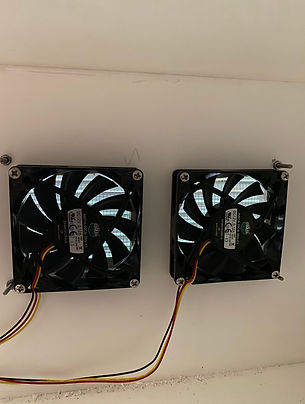
This week our team started and finished mounting all of the panels and light sensors to their respective motors and mounts. Once all 7 of those were complete, we focused on mounting the fans and vents to the side of the base. Having these installed will allow air to flow through the base, helping it cool down and not over heat.

After the vents were put on, the base was just about complete. The last thing we needed was to add the legs, so the base isn't sitting on the floor. The team decided to go with 8 inch aluminum alloy legs.

One of the last things that needed to be completed on the system, was to put all of the motor/panels on the on caps, which go on the end of each branch. This will help prevent water from going into the arms of the system, which would end up flooding the base.


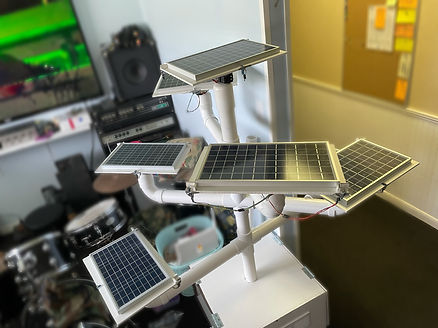
Once all of the panels were mounted and put on the caps, it was time to finally assembly the system! The team put the caps onto each branch and took the wires through the branches and attached everything.


Week 5 (6/6 - 6/12)
This week our team started to secure the base by waterproof the edges of the frame of the solar station. To prevent water from seeping through and damaging our electronics, our team used a sealant to seal the edges and all cracks. Window seal stripes were needed to prevent liquid from coming in from the doors. Doors are necessary for maintenance work and the viewing window. We then proceeded to work on wire management for the motors by soldering all the wires and braiding them. Labels are needed for each motor to correspond to the pins of the Arduino.


Our team was able to create a solar panel template for the solar tracker. The temple can hold the panel in place, along with the light modules and the motors. The back of the template allows used to unmount the solar panel from the template if needed.


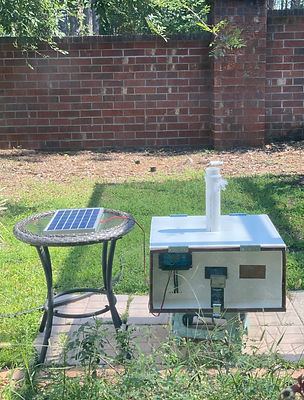
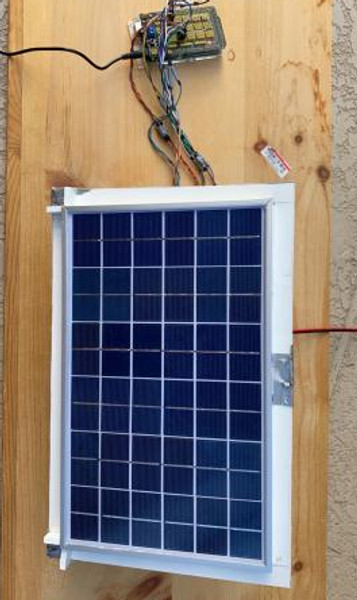
An important objective for our team for this week is to obtain data of the energy that our solar panel of a full day. Our team decided to gather data from 7 am - till the solar panel does not generate current over 10mA. Our system has an LCD screen that reads measurements. This device will be connected to a solar charge controller and the battery. This LCD screen prints the voltage, current, and power that is generated and stored in the battery. Wiring the LCD multimeter screen took time to prepare for the solar station to measure the stationary solar panel.

After setting up the solar station, our team began the official testing of the solar panel when stationary. The data will be compared to the solar tracking data. The at first the data was taken from 7 am to 7 pm. After the first day, we notice that sunlight came in contact with the solar panel around 9 am and ends at 6 pm. This is due to the fencing around the solar station, this blocked light from coming in contact.


After a few days of stationary data readings, the team moved forward with testing out a single tracking system. The time for the readings stayed the same as the stationary testing times.
During observation of the tracking system, the team saw that the current would drop if there were clouds blocking the sun, and a higher current if the sun had no obstructions. Meaning we can gain more energy and power when the sky is clear.

While our single tracking system was hard at work, the team went ahead and completed the rest of the mounts for the panels and light sensors to sit on. Completing all 7 of the tracking modules.
Week 4 (5/30 - 6/5)
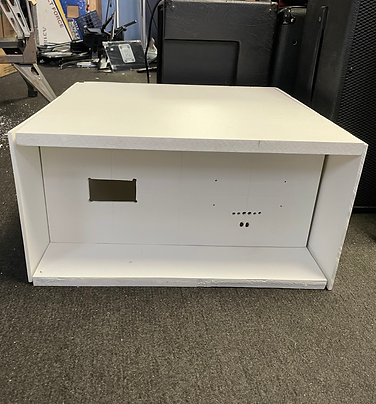
Our team had a group meeting this Monday to complete the base of our solar charging station. We started by re-cutting our base because our original cuts were a little to small. With our new cuts, we started by adding hinges to the back access door of the base. Once we had those 3 solid sides on, we cut a hole in the center of the top panel to create an access for the stem & wires to enter the base seamlessly.
.jpg)


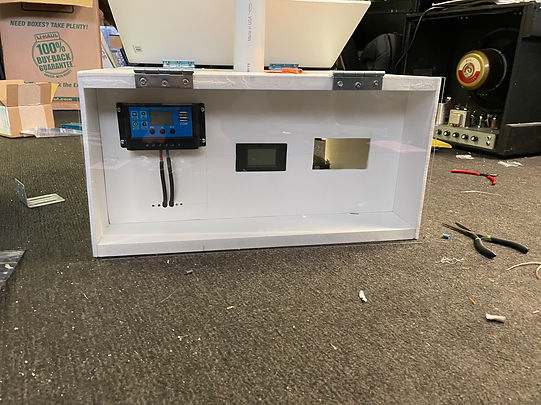
After the stem hole came through the top of the base, we added a T shaped pipe on the inside of the base, ensuring the wires will be fully protected all the way into the base. From there, we put the entire stem on/into the base and added the front panel to the base that holes the solar charge controller, display screen, and inverter to create S.T.A.R.S. We also put the battery and the Arduino into the base to ensure there was enough room for everything, as well as room to spare.
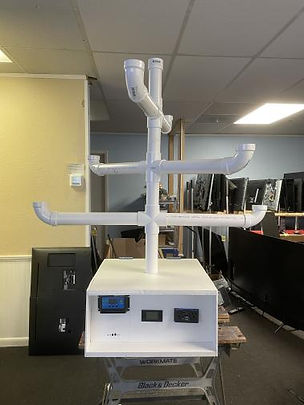.jpg)


After building the base and having an idea of the layout, our team worked on installing the motors and making sure they are wired correctly. The viewing window of the solar tree station is placed and to display data of the solar charger, the solar panel voltage and current readings, and the device charging station.

When installing the wires, we had to label the wires to ensure the solar trackers are connected to the correct pins of the Arduino for the trackers to function. We also focus on building the mounts for the panels to connect the light modules and the motors.
Week 3 (5/23 - 5/29)
Our team had a group meeting this Tuesday to create a checklist needed to build the whole system to proceed into the troubleshooting phase. We proceed to finish cutting the PVC board. An idea came up about redesigning the base. Cutting the acrylic glass became a big issue when it comes to cutting them into pieces. We substitute the material with PVC sheets. The system is majority made out of PVC. We planned to paint the base and have one side be the viewing area to display data.


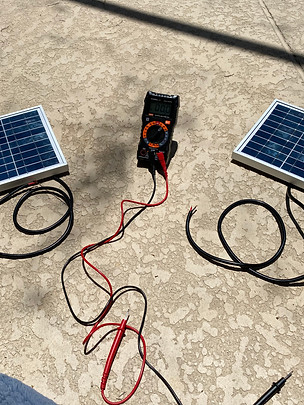
Our team tested solar panels by exposing light to the solar panels and having a multimeter to measure the voltage and current. To ensure that the solar panels will meet our requirements, they to produce a Voltage that is close to the voltage open circuit and a current that is close to the current short-circuit. Based on the reading, this ensures that the solar panels will provide enough energy to our solar station.

The importance of the battery is to have a place to store the power for users to used to charge devices and to power devices when needed outside. Our team tested the battery by hooking up our voltage multimeter. We then proceeded to build our stationary solar station obtain data to see our output of the panels. Our team checked the system in 30 minutes to logged the data. We also tested our solar tracker and watch if the system will adjust itself by redirecting it towards the sunlight. In the image below, on the right, the solar tracker was placed under the shade to see if the tracking system will redirect itself. It was able to angle itself away from the shade and towards the light.


Proceeding to building the based design:
This base has a viewing area for the user to see the solar charge controller displaying data and the energy that the solar panels are providing. Users will be able to access this viewing area to see how much is charge is stored in the battery and how much voltage, current, and power the solar panels are generating.


The image below has the front viewing of the solar tree charging station. The section viewing will provide the base support within the base. This base has gone under-testing to see if it will handle 100lb block.
We were able to test the inverter to see if a user can charge their phone. We also tell the output of the AC output, using a multimeter, and see how much voltage and current the inverter will provide.

Week 2 (5/16 - 5/22)
This week, we started out by building the general idea for our stem & branches for the system. In the pictures below, you can see a shot of just the stem and branches, an areal view, and a photo of it with the cardboard base to see a rough size.
We plan on adding L shaped pipes to the ends of each branch, so the panels can start by facing up, rather than facing sideways out of the pipes.


The previous week, our group started developing the solar tracking system. After testing the motors, we tested the light sensor modules. Light modules are going under testing for several days to adjust light parameters for the solar tracker. For each solar panel for this design, the solar tracker consists of light modules that will guide the motors.
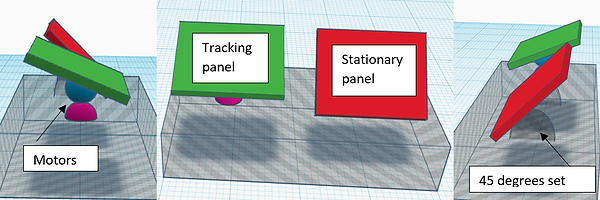
Since motors went under testing last week, we assemble a pair of servo motors to develop the solar tracker. The image below shows the servo motor mounted. There is also a diagram of the amount of coverage we expected the pair of servo motors to cover.


Our group connected a signal light module to an Arduino to place outside to collect data. With this data, we could calculate and adjust the parameters for the solar tracker. 2 light modules will be placed at the bottom of the panel at each corner. A single light module will be placed at the center top of the panel. The image below shows the data collect light system on the left. In the middle are example data to be expected to be collecting from the light testing system. On the right is the test board to display the placement of each light module of the solar tracker.


After obtaining enough data from the light module system, we plan to adjust the solar tracker parameters accordingly.
The image below is the solar tracker system in progress thru far. The current parameter of the solar tracker is tracking a flashlight.

We continually test the program and see if the solar tracker can locate the light. We had to build a new test board to test the solar tracker because the previous board was getting worn out. We also started to build more solar trackers while testing the first one.

Week 1 (5/9 - 5/15)
This week, we were testing components to ensure they worked properly by themselves, as well as with each other.
First, we needed to make sure our microcontroller, the Arduino Mega, worked. We tested its functionality along with the shield we got for it, which expands the amount of input/output ports.
In the process of testing motors and troubleshooting, some issues arose when the motors were not functioning. We had to test the code and observe if the Ardunio or the shield are sending signals. We also used a multimeter and observed if the Arduino can power the motor. A simple circuit was built to test if the Arduino has enough voltage to power the motors.
Using Ohm's law, voltage is equal to resistance times current, our group was able to figure out the input voltage of the Arduino, which is said to provide 5 Voltages.
Using a multimeter, our group measured a resistor at 98 ohms and a current of 50.81 mA. The input voltage is around 5V, which assures us that the Arduino can power the motors.

Circuit to test Input Voltage
After multiple attempts to resolve the issues, our group decided to test 3 other motors that came with the motor that we are currently testing. Without luck, the motor was not able to function as we needed. The process continues for the following day.
On the following day, our group decided to test more motors and realized that we received the wrong motors and had to ship back half the motors we ordered.
This realization occurred after opening the third box and realized the brand name difference. Our group tested the motors and was able to have them function.
Our group came together, on zoom, to discuss creating a prototype of the solar tracker. This prototype will be used to collect data and compared the data to a stationary solar panel.
Our idea to test solar tracking verse stationary
An in-person group meeting on May 14, 2021, to go shopping for PVC pipes to begin the process of building the frame of the tree.
Based on the CAD, we were able to figure out how much PVC was needed for the design. Our group also did some motor testing and made sure that the motor can handle the weight of the panel along with the solar tracker.
The image below shows the parts we are testing and the video below shows our group testing the motors.

bottom of page